 Electricity Cost by State
Download and reuse the data
The rates, bills and charts behind this site as files, a JSON API and an embeddable widget, with the dates and credit line to use.
Current rate month: July 2026, released by the EIA on September 24, 2026. The next EIA month is scheduled for October 23, 2026. Data status and refresh checks.
Files
| Dataset | What it holds | Get it |
|---|---|---|
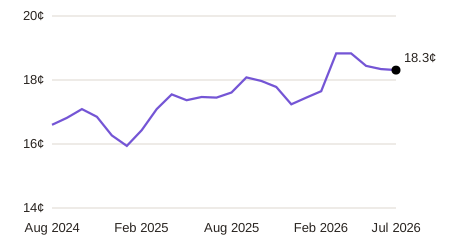
| Monthly residential rates | 52 series (50 states, DC and the US), August 2024 to July 2026, cents per kWh from the EIA API. One row per state and month. | CSV, all states |
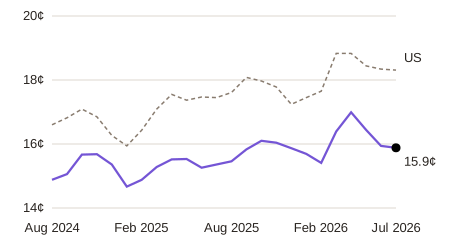
| One state's history | The same 24 months for one state. Replace TX with any two-letter code. | CSV for Texas |
| Rate chart | A standalone SVG of the 24-month US line, or one state's line against the US. | US chart Texas chart |
| Average residential bills | Customers, sales, revenue, average monthly kWh and bill by state for 2024, from EIA's annual tables released October 7, 2025. | CSV |
JSON API and widget
The API returns the same numbers as the pages without a key: rates with history at /api/v1/rates and appliance running costs at /api/v1/cost. The rates response includes a freshness block with the data month and the last source checks. The OpenAPI description lists every appliance and state it accepts. For a live figure on your own page, use the running-cost widget.
What you may reuse
The electricity rates are U.S. government data. The EIA states on its copyright and reuse page that its data are in the public domain, and asks for an acknowledgment that includes the publication date. Our calculations, charts and text can be quoted and linked with credit; reproducing the site or large parts of it needs written permission, as the terms explain.
How to credit
Credit line for figures, charts and the API:
Electricity Cost by State, using EIA data (https://electricitycostbystate.com/), July 2026 EIA residential rates, released September 24, 2026.
Link to the page the figure comes from, for example the state's rate page. For the EIA series itself, cite Electric Power Monthly Table 5.6.A or the EIA Open Data API with its release date.
What changed this month
The rates page describes the latest month against the previous month and the same month a year earlier, from the loaded observations only. Each state page has the same analysis for that state. Figures change when the EIA publishes; the changelog records each refresh.
Limits to keep with the numbers
- EIA state rates are averages: total residential revenue divided by kWh sold. Fixed charges are already spread into them, and one household's plan can differ a lot.
- The newest EIA months can be revised; the files hold the values as retrieved on the date in each row.
- Appliance and car costs are estimates for the stated usage, not measurements of a particular home.